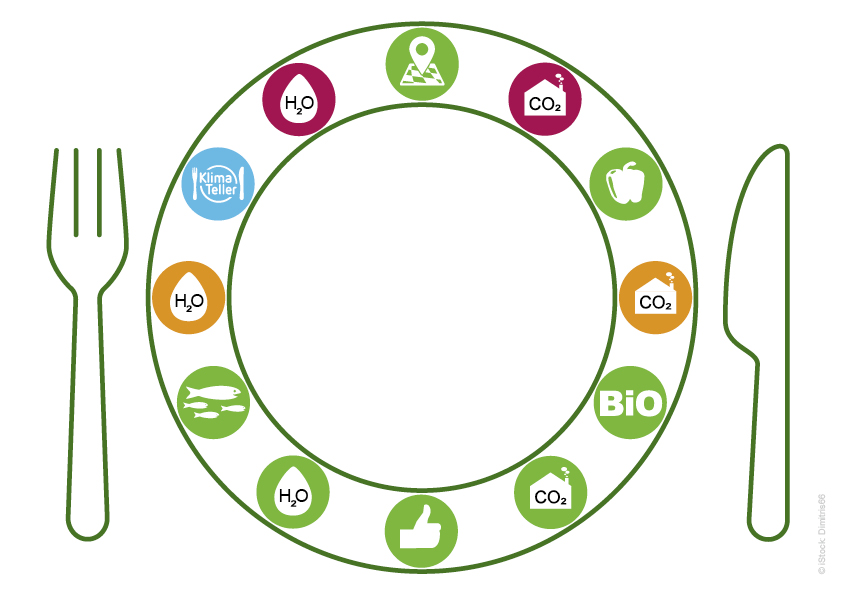
Traffic-Light Labelling – CO2e and Water Footprint as well as KlimaTeller
Transparency on your Plate
Choosing Sustainability
Since September 2024, we have been labelling the CO2e footprint of our dishes in our menus. To provide a simple and efficient overview, this is done by means of traffic-light labelling which shows at a glance how climate-friendly each dish is.
Dishes which cause at least 50% less CO2e than comparable dishes receive the label KlimaTeller.
For establishing KlimaTeller dishes, both the CO2e emissions and the nutritional value according to the recommended daily amounts are taken into account.
Apart from the CO2e footprint we also show further parameters such as the water footprint.
Thus you'll be able to enjoy a nice meal and while making deliberate environmental decisions.
This innovative project is carried out in cooperation with NAHhaft e.V. (https://www.nahhaft.de/). It's supported by the Federal Ministry for Economic Affairs and Climate Action as part of the national climate protection initiative.
It's Your Choice!
Pay attention to the traffic-light and KlimaTeller symbols displayed in our menus!
In order to calculate the CO2e footprint of each dish, the ingredients' origin, transport, seasonality, convenience as well as existing certificates are taken into account. By means of a life cycle assessment the individual CO2e emissions are established.
Evaluating a dish's climate footprint requires a reference. Eaternity, cooperation partner of NAHhaft e.V., has analysed data provided by 150 businesses from the food-service industry for business, industry, schools, universities and health care, situated mainly in German-speaking countries. This data resulted in an average which shows whether a dish improves or increases the CO2e and water footprint compared to it.
The Water Footprint
Resource Water – the Blue Gold
Water means life – drinking water is a precious resource.
Since September 2024, we have also been labelling our dishes' water footprint in our menus. The amount of fresh water which is used for the product in the individual production region and the relative water shortage in the region are taken into account. Here, we also use the traffic-light symbols to provide an efficient overview. The colours show how high the water usage of a dish is compared to other dishes.
The data is provided by Eaternity (https://eaternity.org/) who was commissioned for this purpose by our project partner NAHhaft e.V.
The project is supported by the Federal Ministry for Economic Affairs and Climate Action as part of the national climate protection initiative.
More detailed information on how the water footprint is calculated can be found here:
https://eaternity.org/foodprint/environmental-footprints#water
A simple way to eat consciously – it's your choice.
And this is how our traffic-light system works in cooperation with
NAHhaft
This dish improves the CO₂e footprint considerably. The dish's CO₂e emissions are less than half the average CO₂e emissions of all dishes taken into account. | |
This dish improves the CO₂e footprint slightly. The dish's CO₂e emissions are below the average CO₂e emissions of all dishes taken into account. | |
This dish increases the CO₂e footprint. The dish's CO₂e emissions are above the average CO₂e emissions of all dishes taken into account. | |
This dish's water usage is more than double the average of all dishes taken into account. | |
This dish's water usage is at most double the average of all dishes taken into account. | |
This dish's water usage is below the average of all dishes taken into account. |
German source: NAHhaft e. V.
